.png)

In the past, measuring the success of learning and development programs on organizational performance has been a persistent challenge. As businesses increasingly invest in the growth and efficacy of their leaders, the need for a clear and comprehensive understanding of the Return on Investment (ROI) is essential.
This blog post dives into the metrics defining the ROI of leadership development. No more ambiguity—just strategic insights to measure real impact on organizational success.
.png)
The gains from learning, particularly in leadership development, can be succinctly summarized as total tangible benefits. Here, "tangible benefits" denote real, measurable advantages that directly impact your bottom line.
Tangible benefits of leadership development:
- Revenue directly attributed to leadership development
- Savings from retention as a result of leadership development
- Savings as a result of reduced turnover
Each of these measurable outcomes not only contributes to the overall success of the organization but also underscores the concrete, financial value of strategic investments in leadership growth.
Transitioning to the practical aspect of measuring the tangible benefits of leadership development, our approach cuts through the complexity of ROI. We recognize the need for simplicity in understanding and articulating the impact of leadership development on organizational success. In this vein, we rely on straightforward metrics that offer clear insights.
The three pivotal metrics you need to calculate the tangible benefits of leadership development include:
- Revenue Growth Rate: the percentage increase in overall revenue attributed to leadership development efforts.
- Employee Retention Rate: percentage of retained employees after leadership development.
- Costs of Turnover Reduction: reduced costs associated with turnover in recruitment, onboarding, and training.
Let's walk through the formulas with tangible examples:
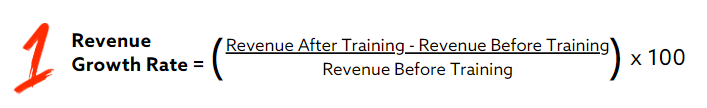
The Revenue Growth Rate is your key to quantifying the direct impact of leadership development on your organization's financial health. This formula measures the percentage increase in overall revenue attributed to your leadership development efforts. A positive growth rate signifies a tangible return on your investment, highlighting the concrete financial benefits derived from your commitment to leadership development.
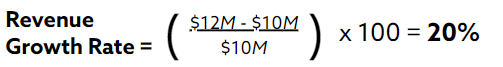
Let's assume an organization's overall revenue before leadership development initiatives was $10 million. After implementing leadership development, the revenue increased to $12 million. Using the Revenue Growth Rate formula:
Next, we calculate the percentage of retained employees after leadership development. This metric provides a snapshot of your leadership development's effectiveness in cultivating a loyal and committed workforce.
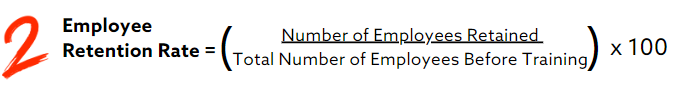
The employee retention rate provides a percentage revealing the proportion of employees retained post-development, offering an indicator of the program's impact on employee satisfaction, and overall organizational resilience.
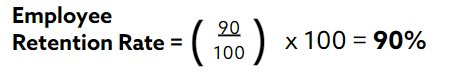
If our example organization put 100 employees through leadership development training in January 2023, and one year after the training concluded in January 2024, 90 of those employees who took the training remained, our Employee Retention Rate formula would look like:
Next, we calculate the cost of turnover reduction. This captures reduced costs associated with turnover in recruitment, onboarding, and training. This metric serves as a powerful tool to unveil the financial advantages gained through effective leadership development.
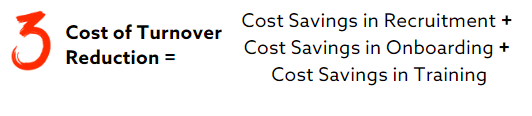
Cost savings in recruitment accounts for the reduced expenses associated with finding and hiring talent. Cost savings in onboarding shows the decreased expenses linked to the orientation and integration of new hires into the organization. Cost savings in training sums up the financial benefits accrued from minimizing the expenses associated with training new employees.
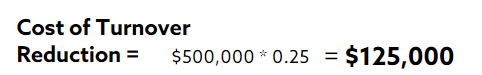
Turnover cost varies by industry, company and skill level. Let's say that our example organization spent $500,000 on recruitment, onboarding, and training before leadership development, and after, these costs were reduced by 25%. Using the Cost of Turnover Reduction formula:
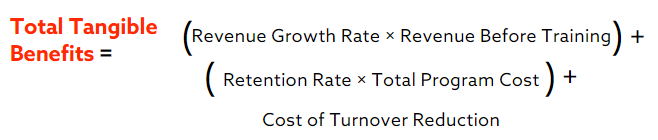
After calculating the Revenue Growth Rate, Employee Retention Rate, and Cost of Turnover Reduction, you have the essential metrics to calculate the total tangible benefits of leadership development. A strategic and data-driven approach is essential for understanding the tangible impact of leadership development initiatives on both individual leaders and the overall business.
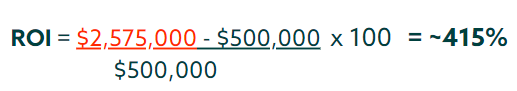
For our example organization, let‘s estimate the total program cost is $500,000. With this information, we can now sum the total tangible benefits of the companies leadership development initiatives.

Calculating total tangible benefits is one way that organizations can measure the impact of learning and development initiatives. If we plug our total tangible benefits number into our ROI formula as gain from learning, our example organization displays an ROI of 415%, indicating a substantial return on the investment made in the program.
This example illustrates the quantifiable success achieved through cultivating a skilled and engaged workforce, resulting in increased revenue, higher employee retention, and significant cost savings.
Ready to maximize your learning and development ROI? Our live, interactive and personalized approach ensures tangible results. Schedule a meeting to see how it works.
Bundle’s mission is to develop and upskills today’s workforce for tomorrow.
Our human-centric learning cultivates vital skills that enhance practical abilities while prioritizing the well-being of the worker. We engage learners in their context with personalized learning, asking questions and digging deeper in 1:1 live sessions with expert instructors.